Product Data: Calculating Lifetime Value
Following up on my first post on ERPI, it’s time to dive further into analyzing your data to drive business results. To calculate a lifetime value with cohort churn data, you use a chart like shown here.
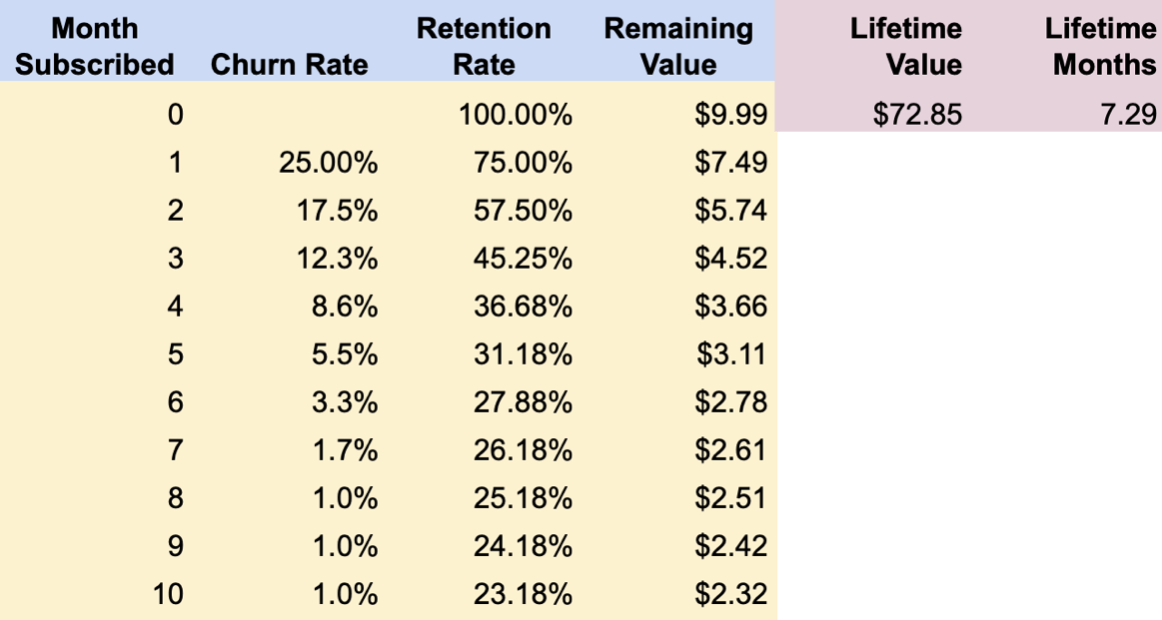
Down the left side, you can see each month a member is subscribed. Next, you’ll see some example values of churn rate for members during each month. If the price of your subscription is $9.99/month, we can calculate the remaining value of each month. From there, you add up those values to arrive at an average lifetime value.
However, keep in mind that some members will stay much longer and spend much more money. Generally, churn rates are far lower in the later months than the earlier months. In other words, an average lifetime of 7 months could mean some members are staying for 20 months or more. The chart above cuts off after 10 months.
But how do you calculate average lifetime value before the cohort matures? We can’t look into the future and know how the December cohort of subscribers is going to perform. We can only look at historical data and use it to make a sound estimation. Then we can measure the same data every month (or every week with advanced tools) and be able to understand the performance of our subscription retention, and in turn, ERPI.
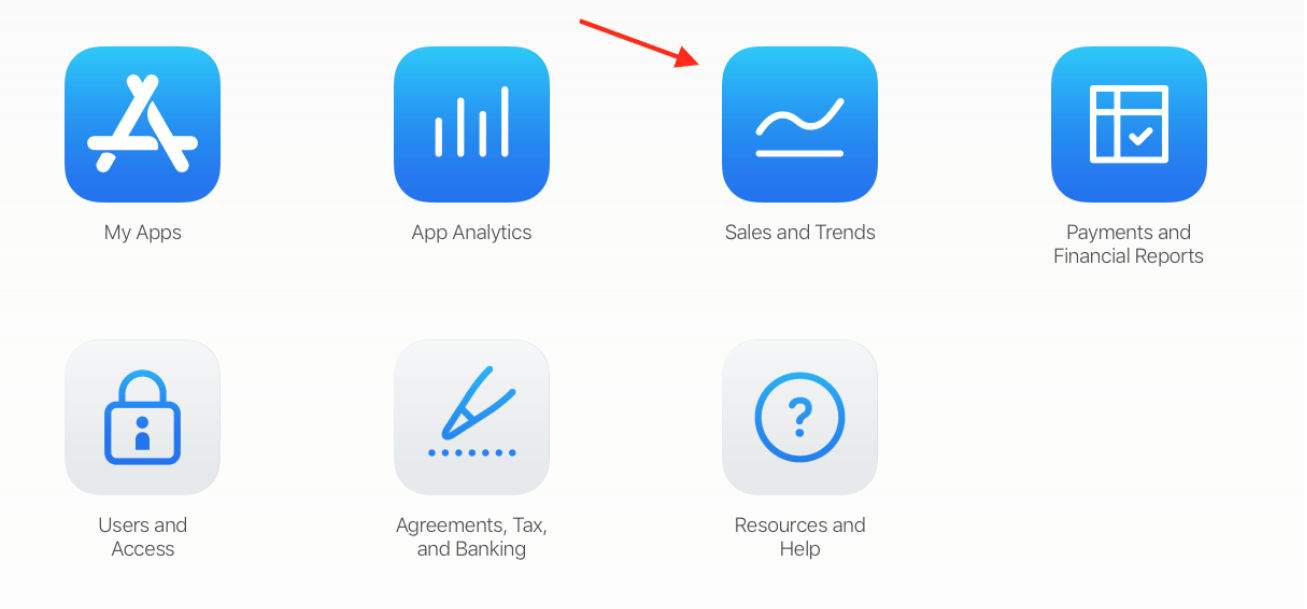
To pull relevant historical data for subscription churn, head on over to your App Store Connect dashboard (this is different for Google Play, and more difficult to pull manually). Again, I’m going to describe the “startup” way of pulling this data, but the process can certainly be automated.
In the App Store Connect, visit the Sales and Trends page:
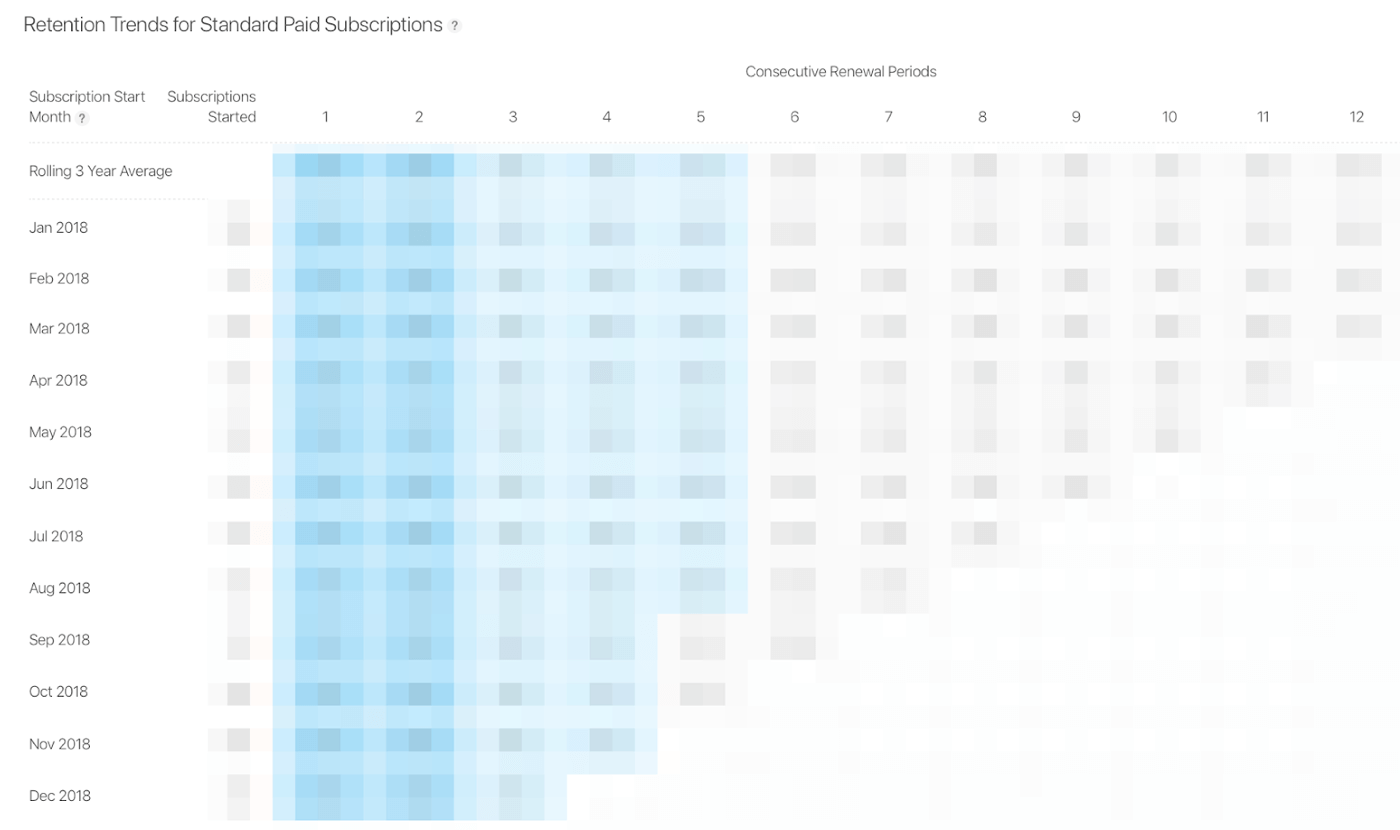
- Click on the Retention tab, under Subscriptions.
- Use filters to select only subscription products with the same duration for a single app.
- Click on Subscription Start Month and choose a month / 1-year prior to the cohort month you want to calculate.
Now you can see the retention rate for each cohort (1 – retention rate = your churn):
Let’s look at a similar chart in a spreadsheet to see how we could pull this data. Here it is with some made up numbers:
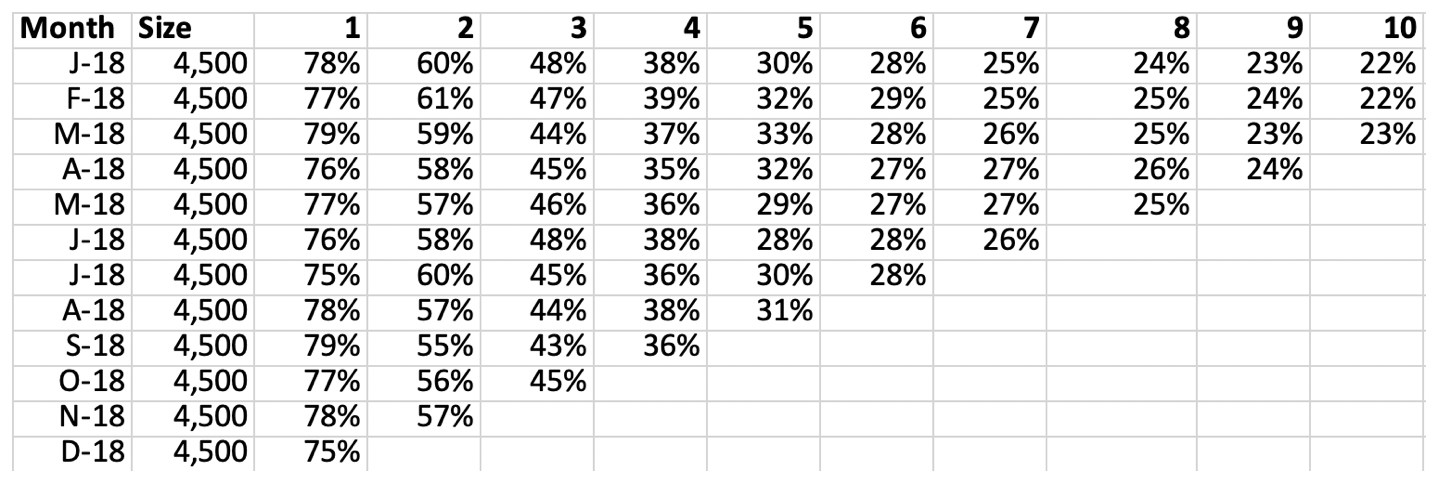
To estimate the current cohort’s LTV, take the last mature month of each cohort as highlighted below:
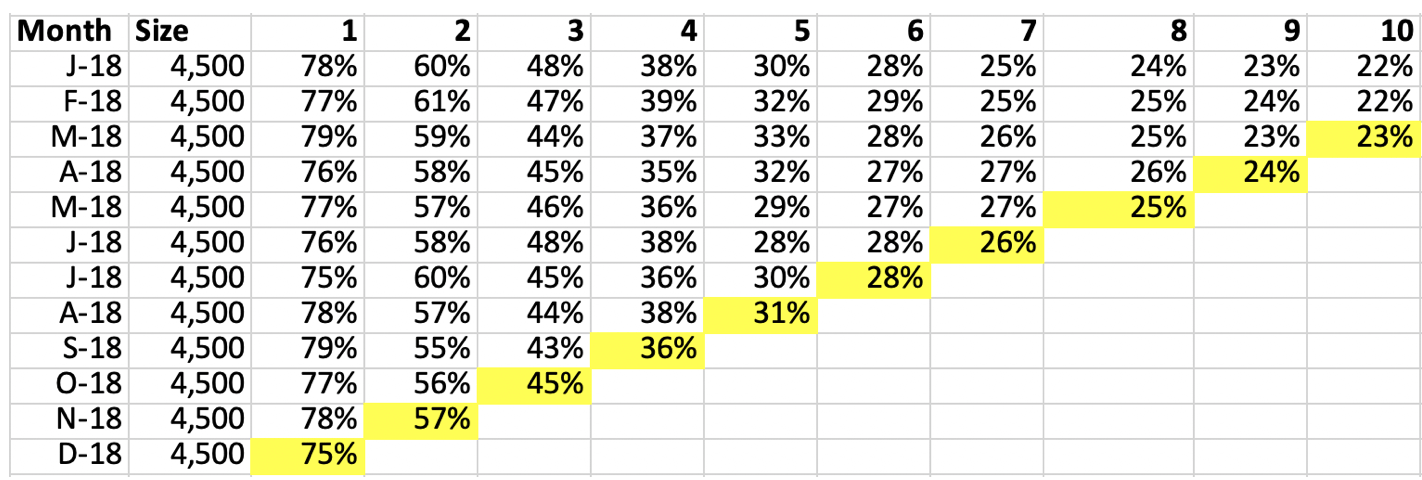
To make this calculation more robust, you could opt to average the last 3 months of matured cohort data. If you work on a seasonal product, you may have to choose different cross sections of your historical data.
Certainly, users coming into your product 9 months prior have different intentions and user experiences than users who join one month prior.
To say that the newest members will churn out at the same rate as the members from 9 months prior might be difficult. But, all of these members were using the product at the same time for each of those cohorts. In this example, they were all using the product in December. Furthermore, only the March cohort (at least, what’s left of them) was using it for 9 months and the December cohort for one month.
The figures from these highlighted cells plug into your lifetime value calculations (flipped around for churn). As a result, you can see an average lifetime value estimation of your most recent new users. With these calculations, you can calculate your average lifetime value. Plus, you can calculate ERPI. See the highlighted figures below:
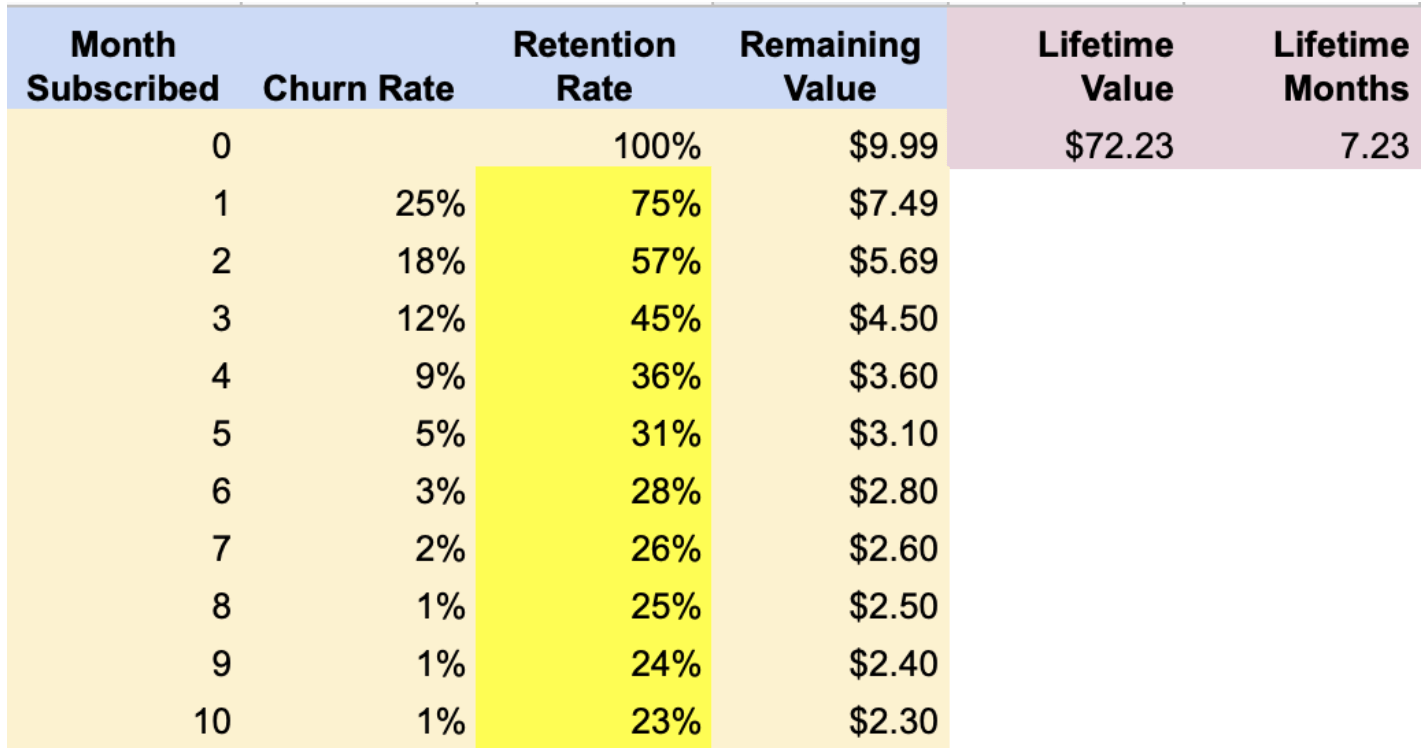
The chart above is again cut off after 10 months, but the resulting lifetime value incorporates a projection of continued 1% churn by each month subscribed, until the cohort is exhausted. Check out the spreadsheet for more details.
There are numerous steps of your product funnel, but ERPI can be used as an output measurement to understand the result of all of those steps – and how much revenue each app install is expected to bring in.
ERPI can also be used as an input tactic – product teams can evaluate different investments across their funnel, and understand the impact on ERPI from reasonable projections as to the performance of these potential product investments.
About the speaker
An experienced and creative entrepreneur and product leader, Britt Myers has developed an impressive resume of business successes in media and technology production. In 2014, Myers partnered with Stephanie Dua as co-founder and Chief Product Officer of ed-tech startup Homer. Homer is the #1 Learn-To-Read program powered by your child’s interests; an educational app for iOS and web that teaches a child to read and develops crucial early childhood cognitive skills.